Map, Maps, Maps!
Sunday, April 24, 2011
Star Plots
http://www.math.yorku.ca/SCS/sugi/sugi16-paper.html
This is an example of a star plot. There are many examples of star plots on this picture.
Correlation Matrix
http://www.kltprc.net/policynotes/Gifs/Tab_005A_4.htm
This is a photo of a correlation matrix. This is a way to understand how certain categories can be compared.
Similarity Matrix
http://cgi.mtc.sri.com/Cluster-Lab/
This is a view of a similarity matrix. The different colors depict different amounts from the category.
Stem and Leaf Plot
http://www.northstarmath.com/sitemap/Stem-and-LeafPlot.html
This is a classic example of a stem and leaf plot. This is an easy system of seeing information.
Box Plot
http://www.itl.nist.gov/div898/handbook/eda/section3/boxplot.htm
This is a box plot graph. In box plot graphs it helps to compare different amounts with showing where the median is.
Histogram
https://visualization.hpc.mil/wiki/Paraview_Histogram
This is a picture of a paraview Histogram. This is comparing different categories with colors and data.
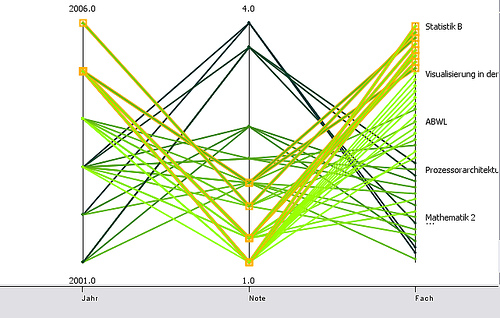
Parallel Coordinate Graph
http://informationandvisualization.de/blog/knime-interactive-views
The parallel coordinate graph can compare many different attributes. These types of graphs are great for visualizing how different categories compare.
Older Posts
Home
Subscribe to:
Posts (Atom)